The EtG calculator chart
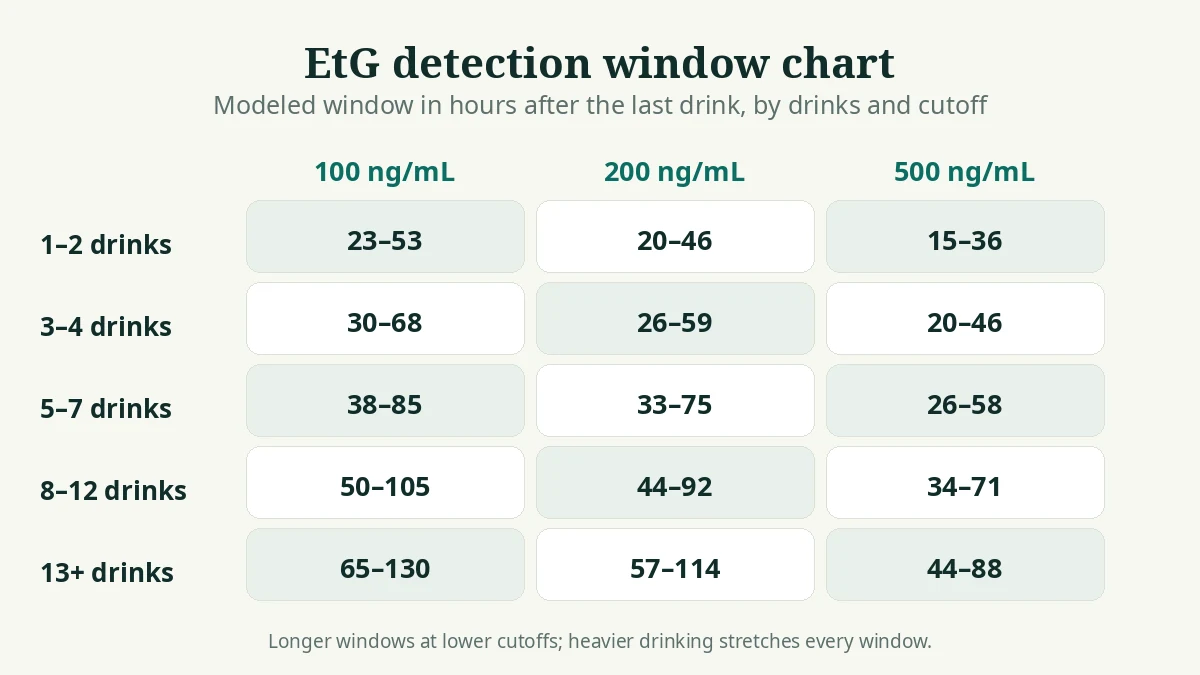
Every cell below is a modeled window in hours after the last drink, for one drinking session lasting about four hours, computed with the same model as the calculator on this page. Read across a row to see what the cutoff does to the same drinking; read down a column to see what heavier drinking does at the same cutoff. A time before a window opens is modeled as likely above that cutoff; a time inside the window is genuinely uncertain; a time after it closes is modeled as likely below.
| Drinking (one session) | 100 ng/mL | 200 ng/mL | 500 ng/mL |
|---|---|---|---|
| 1–2 drinks | 23–53 hours | 20–46 hours | 15–36 hours |
| 3–4 drinks | 30–68 hours | 26–59 hours | 20–46 hours |
| 5–7 drinks | 38–85 hours | 33–75 hours | 26–58 hours |
| 8–12 drinks | 50–105 hours | 44–92 hours | 34–71 hours |
| 13 or more drinks | 65–130 hours | 57–114 hours | 44–88 hours |
How to read the chart
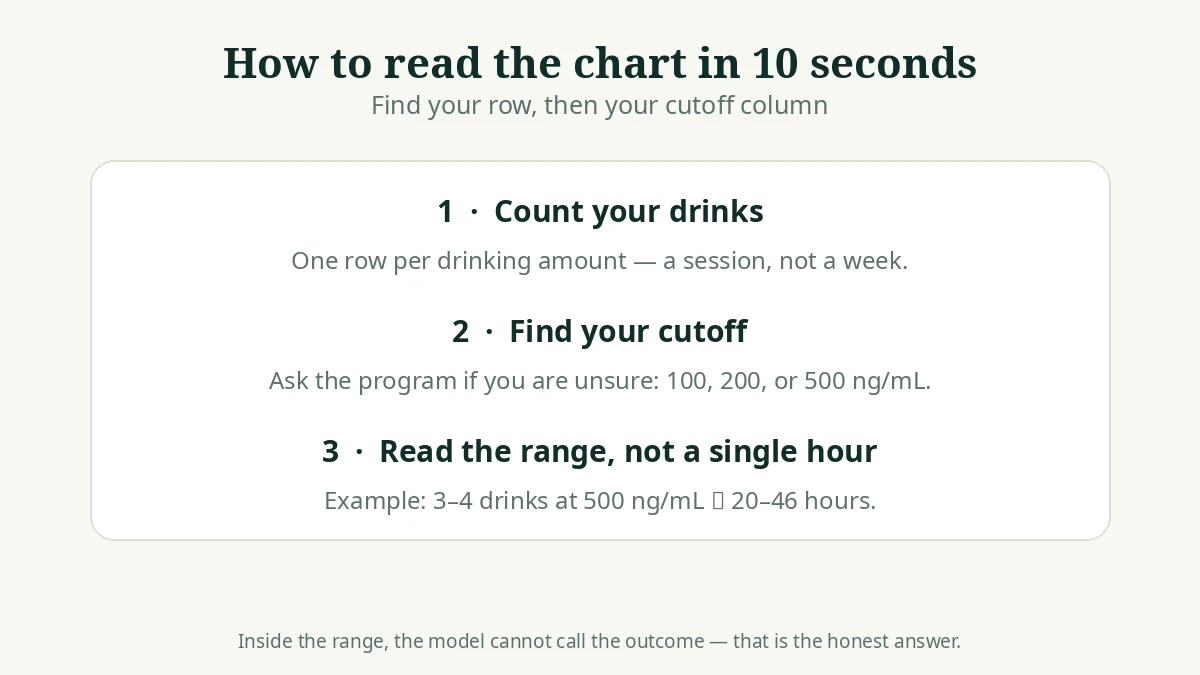
Step 1: count your drinks. Use U.S. standard drinks — 12 oz of beer at 5%, 5 oz of wine at 12%, or 1.5 oz of spirits at 40%. Find the row that contains your count. If you drank across several days rather than one session, the chart understates your window: use the calculator above and choose “Repeated”, which extends the top end of the range.
Step 2: find your cutoff. The column matters as much as the row. A program testing at 500 ng/mL and a program testing at 100 ng/mL will read the same urine sample differently, and neither is wrong — they are measuring against different bars. If your cutoff is unknown, the three columns together give you the full spread of plausible outcomes, and the 100 ng/mL column is the conservative one to plan around.
Step 3: read the range, not a point. A cell like “20–46 hours” does not mean detection ends at some hour inside it that we declined to name. It means the research supports a window that wide: before 20 hours the model expects the level to still be above 500 ng/mL, after 46 hours it expects it to be below, and between the two the model genuinely cannot call it. Planning around the middle of a range is planning around a guess.
Why the cutoff changes everything
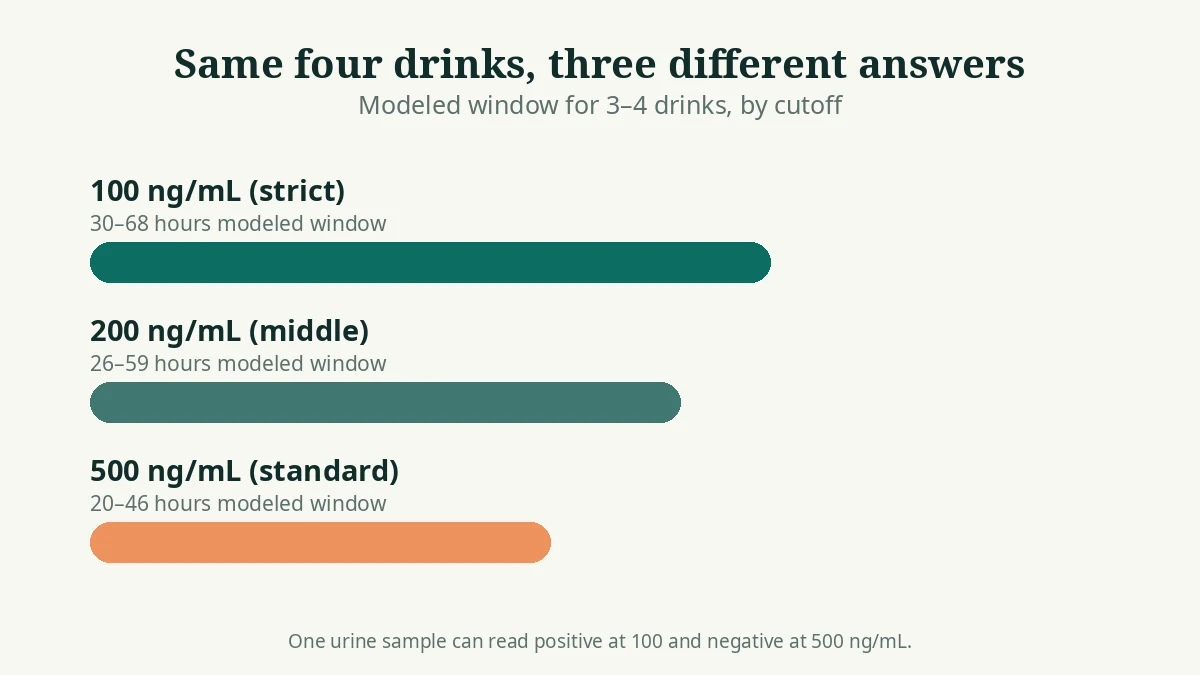
Take four drinks as the worked example, because it sits in the middle of the chart. At 500 ng/mL the modeled window is 20–46 hours; at 200 ng/mL it is 26–59 hours; at 100 ng/mL it is 30–68 hours. The same person, the same night, the same urine — and a test taken 50 hours later is past the window at the standard cutoff but still inside it at the strict one. Any detection time quoted without a cutoff attached is missing the variable that decides the outcome, which is why every row of this chart carries all three.
This is also why arguments about detection times so often talk past each other. A workplace program quoting 500 ng/mL numbers and a probation program quoting 100 ng/mL numbers are not disagreeing about biology; they are answering different questions. The chart resolves the argument by showing both answers side by side.
Why the chart shows ranges, not one number
Some detection-time pages publish a single clearance hour, built on a fixed peak level per drink — one competitor, for example, models every drink as adding the same fixed ng/mL figure. That arithmetic is tidy, and it is not how bodies work: drink strength, food, body composition, timing, and metabolism all change the real peak, so a fixed per-drink constant manufactures precision the research does not support. The published literature supports a half-life range of roughly 2 to 3 hours and cutoff-dependent windows, and this chart is built from that: the site's model, verified against the live homepage calculator, with the range carried through every cell.
The width of each range is itself information. Light-drinking rows are narrow because there is less to vary; heavy rows are wide because small differences in half-life compound over many half-lives. When a chart's ranges widen with drink count, that is the model telling the truth about its own uncertainty — not a flaw to be polished away.
What moves you inside the range
Five factors decide where inside a cell a real result lands. Repeated drinking stacks EtG across days, extending the top end of the window. Session length matters because drinking spread over many hours keeps adding EtG while earlier amounts are still clearing. Urine dilution lowers the measured concentration in a sample without removing EtG faster, and labs check creatinine and specific gravity to flag it. Test method matters because immunoassay screening and LC-MS/MS confirmation differ in sensitivity and in how they handle borderline results. And individual metabolism and kidney function shift the half-life itself. The calculator above lets you adjust the first two; the last three are why the range exists at all.
Use the chart with the calculator
Start with the chart for the shape of the answer, then refine it. Example: four drinks on Saturday night, a test on Tuesday morning about 60 hours later. The chart says 30–68 hours at 100 ng/mL and 20–46 hours at 500 ng/mL — so Tuesday sits inside the strict window but past the standard one. Enter your own numbers above, including your session length, and the calculator adds the 12-hour timeline table so you can see exactly when each cutoff flips from “Likely above” to “Transition zone” to “Likely below”. That timeline, not any single cell, is the most useful thing on this page.
Frequently asked questions
What is the EtG detection window for 3 drinks?
For 3–4 drinks in one session, the modeled window is 30–68 hours at 100 ng/mL, 26–59 hours at 200 ng/mL, and 20–46 hours at 500 ng/mL. The cutoff is part of the answer: the same three drinks clear a 500 ng/mL test roughly a day earlier than a 100 ng/mL test.
Why does the chart show a range instead of one number?
Because EtG elimination varies: published studies report a half-life of roughly 2 to 3 hours, and urine concentration, dilution, test method, and individual metabolism all shift a real result. A chart that prints one hour hides all of that uncertainty. The range is the honest answer — it tells you where the outcome is genuinely undecided.
Which cutoff does my test use?
It depends on the program, and the only reliable source is the program itself. Workplace screening commonly uses 500 ng/mL; strict monitoring and probation programs often use 100 or 200 ng/mL. If you do not know your cutoff, read all three columns: they bracket every plausible outcome.
Does drinking more really extend the window that much?
Yes, and the reason is simple arithmetic. EtG roughly halves every 2 to 3 hours, so doubling the starting amount adds roughly one half-life to the time needed to fall below a cutoff — but the model also widens the range, because heavier drinking brings more variation. That is why the chart's rows grow both longer and wider as drink count rises.
Can I use this chart to predict whether I will pass?
No. The chart models typical elimination; it cannot see your urine concentration, kidney function, test method (immunoassay screening vs. LC-MS/MS confirmation), or incidental exposure. Treat a time inside a range as genuinely uncertain, and never use this chart to make medical, legal, employment, or supervision decisions.
How is this chart different from the 80-hour figure?
Eighty hours is the heavy-drinking, sensitive-cutoff end of the research — real, but not typical. This chart puts that figure back in context: only the heaviest rows at the strictest cutoff approach or pass it, while light drinking at a standard cutoff closes within about a day and a half.
Evidence and limitations
This page summarizes primary research and public-health guidance. Group-level findings cannot predict one person's result.
Sources: