A minor detour in ethanol metabolism
Most of the ethanol a person drinks follows a well-known route out of the body. The liver enzyme alcohol dehydrogenase converts it to acetaldehyde, and aldehyde dehydrogenase quickly converts that to acetate, which is eventually broken down into carbon dioxide and water. This oxidative pathway handles well over nine-tenths of a typical dose and finishes relatively quickly, which is why breath and blood alcohol measurements fall over a matter of hours.
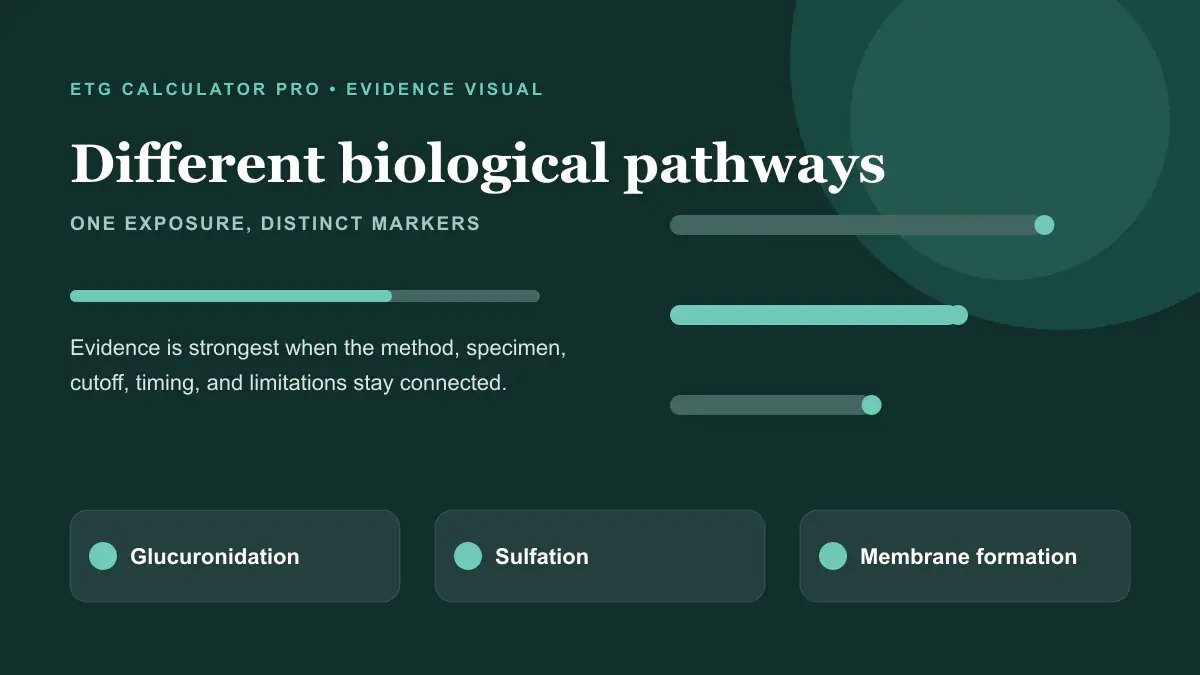
A much smaller share of ethanol takes a different route. A family of liver enzymes called UDP-glucuronosyltransferases can attach ethanol directly to glucuronic acid, a molecule the body normally uses to package waste products for excretion. The product of that reaction is ethyl glucuronide. A related enzyme pathway, sulfation, produces ethyl sulfate (EtS) from the same starting material. Neither reaction handles much of the total dose, but both produce metabolites that are unusually specific to ethanol exposure and that the kidneys excrete into urine over a longer stretch of time than ethanol itself remains measurable.
Why EtG outlasts the alcohol that produced it
Ethanol itself has a short window: breath and blood measurements typically fall to zero within several hours of moderate drinking. EtG behaves differently because it is a downstream product that accumulates in urine as the kidneys filter it out, and because urine as a specimen naturally concentrates compounds compared with blood. Research using controlled dosing protocols has repeatedly shown that EtG can remain measurable well after breath alcohol has returned to zero, with the exact duration depending heavily on dose, hydration, and the laboratory cutoff used to call a result positive.
This is the entire premise behind extended detection-window claims, including the widely repeated '80-hour' figure. It is a real finding from real research, but it describes a possible upper end under specific conditions—generally higher doses, sensitive cutoffs, and concentrated urine—not a fixed countdown that applies to every person and every drink. Our own 80-hour EtG explainer walks through where that number comes from and why it should not be read as a universal guarantee.
Why specificity made EtG the preferred biomarker
Before EtG testing became common, urine alcohol testing generally measured ethanol itself, which creates two practical problems. First, ethanol clears the body quickly, so a urine ethanol test mostly answers a narrow question about very recent use. Second, trace ethanol can appear from fermentation processes in a collected sample or from a handful of incidental sources, which complicates interpretation at very low levels.
EtG changed the calculus because the glucuronidation pathway is a genuine metabolic signature of ethanol exposure rather than a measurement of ambient or residual ethanol. That specificity is why monitoring programs, laboratories, and researchers gradually adopted EtG—often alongside EtS—as a more informative marker of recent drinking. It does not eliminate every source of uncertainty (our false-positive guide covers the genuinely relevant incidental-exposure scenarios), but it substantially narrows the interpretation problem compared with testing for ethanol directly.
Screening versus confirmation: two different biochemistry questions
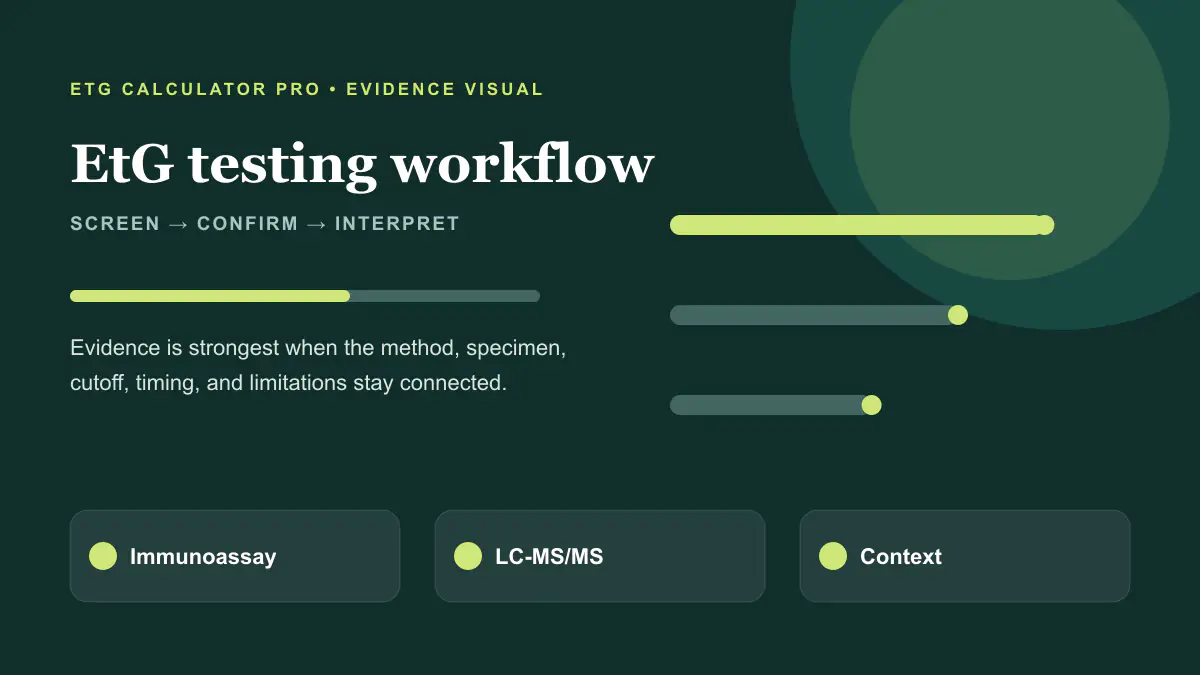
Most EtG testing starts with an immunoassay screen, which uses antibodies calibrated to react around a chosen cutoff. It is fast and scalable, but antibody-based methods can be less specific than a chromatographic method. Liquid chromatography–tandem mass spectrometry (LC-MS/MS) separates and identifies compounds by mass, which allows a laboratory to confirm that a signal really is EtG—and often to measure EtS in the same run for corroboration. Our immunoassay vs LC-MS/MS explainer goes deeper into how these two steps differ and why the distinction matters for a disputed or consequential result.
What the biochemistry does not tell you
It is tempting to treat a quantitative EtG number as a precise readout of how much a person drank and exactly when. The biochemistry does not support that leap. Two people who consumed different amounts, at different times, can end up with similar concentrations depending on kidney function, hydration status, how concentrated or dilute the urine sample happens to be, and how quickly their bodies produce and excrete the metabolite. Our quantitative EtG levels guide and creatinine and dilution guide both cover this in more depth, because it is one of the most commonly misunderstood parts of result interpretation.
This is also why the calculator on this site reports a range tied to common laboratory cutoffs rather than a single confident number or an exact hour. The underlying research supports population-level patterns, not an individual guarantee, and presenting anything more precise than that would overstate what the evidence can actually deliver.
Turning the science into a usable estimate
None of this means the biochemistry is unusable—it means it needs to be applied carefully. Our calculator methodology page documents exactly which studies inform the detection-window ranges, how cutoff selection changes the estimate, and what the tool intentionally does not attempt to predict. If you want to see how elapsed time interacts with a chosen cutoff for a specific scenario, the EtG timeline calculator and the main EtG urine calculator apply this same evidence base directly.
Frequently asked questions
Can the body produce EtG without any alcohol exposure?+
No—EtG formation requires ethanol as a starting material, which is what makes it a relatively specific biomarker. However, ethanol itself is present in many everyday products at low concentrations, so incidental exposure at very sensitive cutoffs is a genuine, if uncommon, consideration. See our false-positive guide for the specific scenarios worth knowing about.
Why do some laboratories test EtS alongside EtG?+
EtS forms through a separate metabolic pathway (sulfation rather than glucuronidation). Measuring both can help corroborate a result and add context when a sample's validity or an unexpected pattern is being questioned.
Does a higher EtG number always mean more alcohol was consumed?+
Not reliably. Collection timing and urine concentration can move the number substantially independent of dose, which is why we avoid presenting exact drink-count conversions from a concentration alone.
Evidence and limitations
This article summarizes primary research and public-health guidance. Group-level findings cannot predict one person's result.