What “elimination” actually means for EtG
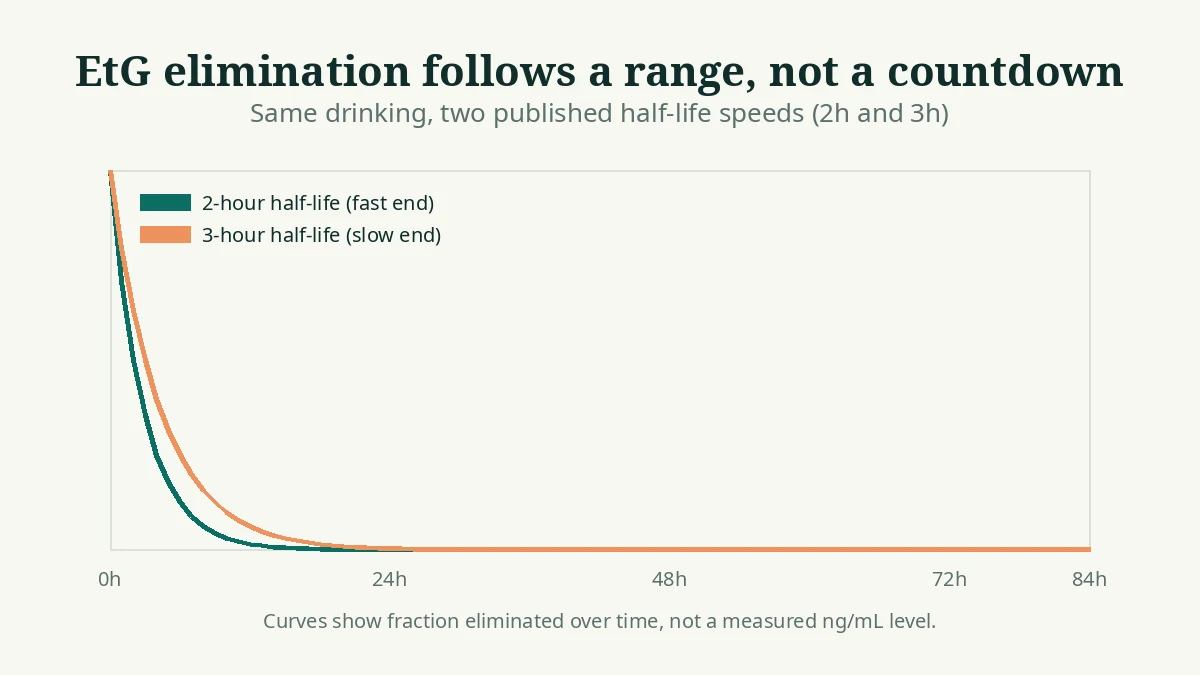
When you drink, your liver converts a small fraction of the ethanol into ethyl glucuronide (EtG), which is then excreted in urine. EtG itself is eliminated with a half-life reported across studies at roughly 2 to 3 hours: every few hours, about half of what remains is gone. That sounds like a countdown — but a urine test does not watch the countdown. It takes one sample at one moment and asks whether the EtG concentration in that sample is above or below the program’s cutoff.
That distinction is why elimination calculators disagree. A test at 500 ng/mL goes negative much earlier than the same sample tested at 100 ng/mL, because the lower bar takes longer to fall below. And a heavy session starts from a higher peak, so it needs more half-lives to drop under any cutoff. Two inputs — how much, and which cutoff — decide the timeline more than any other factor.
The calculator on this page does not invent a peak EtG level for you. Instead it uses the site’s published model — the same model behind our cutoff calculators, verified against the live homepage calculator — to give a modeled detection window for each cutoff, then maps those windows onto a timeline you can read hour by hour.
How to read your elimination timeline
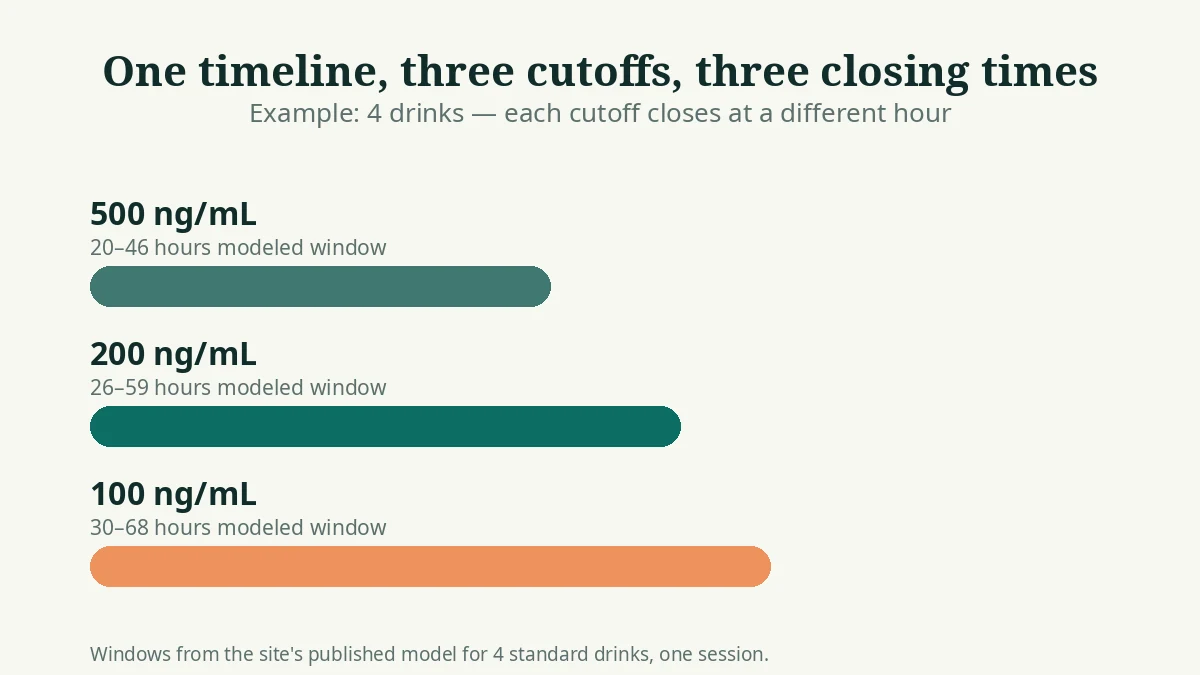
Enter your drinks, how long the session ran, whether drinking repeated over days, and the hours since your last drink. The result shows three things. First, the modeled window for each cutoff — for example, four drinks give roughly 30–68 hours at 100 ng/mL, 26–59 at 200 ng/mL, and 20–46 at 500 ng/mL. Second, your status right now at each cutoff: “Likely above” before the window opens, “Transition zone” inside it, “Likely below” after it closes. Third, a full timeline table in 12-hour steps, so you can see when each cutoff flips from one status to the next.
The transition zone deserves respect. Inside it, the model genuinely cannot tell you the outcome: a faster metabolism or dilute urine could already be below the cutoff, while a slower metabolism or concentrated morning urine could still be above it. A test scheduled inside the transition zone is the least predictable test you can take — and that is useful information, not a failure of the tool.
An elimination scenario: Friday drinks, Monday test
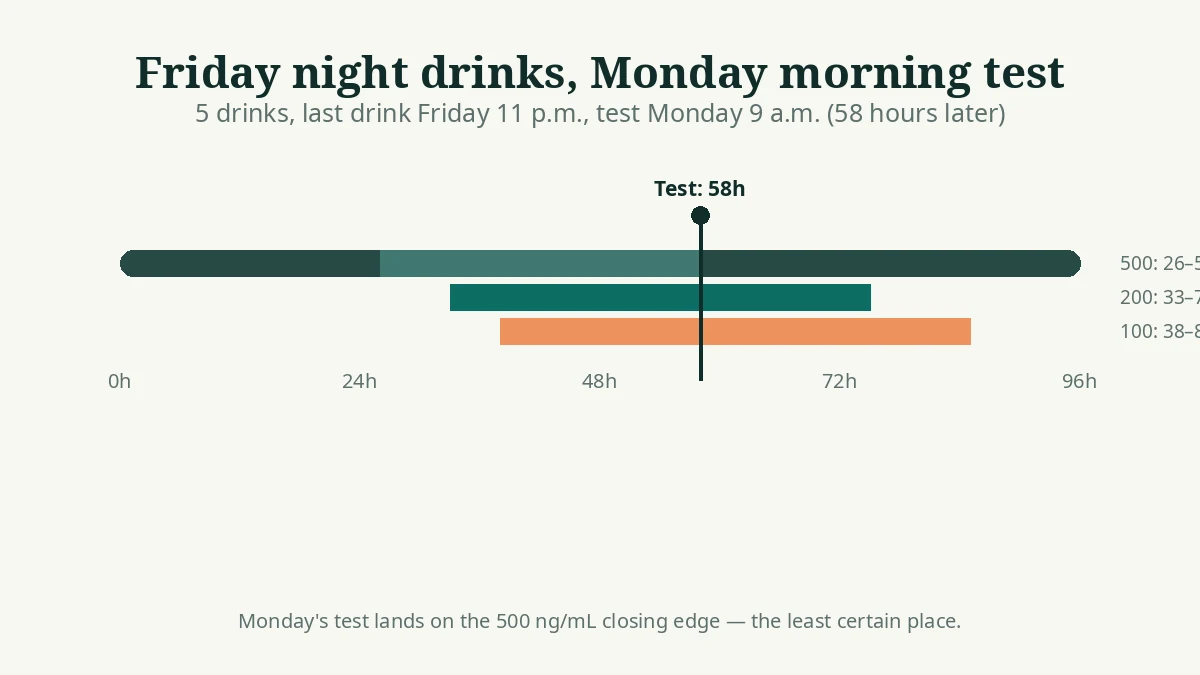
Take a common situation: five standard drinks on a Friday night, last drink around 11 p.m., and a scheduled urine screen Monday at 9 a.m. — 58 hours later. The calculator models five drinks as roughly 26–58 hours at 500 ng/mL, 33–75 at 200 ng/mL, and 38–85 at 100 ng/mL.
At 58 hours, Monday’s test lands exactly on the 500 ng/mL closing edge — the worst place for certainty — while sitting squarely inside the 200 and 100 ng/mL windows. Change the cutoff and you change the answer: the same urine, tested three ways, could plausibly read negative at 500 ng/mL and positive at 100 ng/mL. Anyone who tells you a single elimination time without naming the cutoff is leaving out the variable that matters most.
Why fixed-number elimination calculators mislead
Some elimination calculators publish a single clearance time built on a fixed peak level per drink — one competitor, for example, models every drink as adding the same fixed ng/mL figure. That arithmetic is tidy, and it is not how bodies work: drink strength, food, body composition, timing, and metabolism all change the real peak, so a fixed per-drink constant manufactures precision the research does not support.
The published literature supports ranges: a 2–3 hour half-life, windows that widen with heavier drinking, and cutoff-dependent closing times. Our methodology page shows exactly how this calculator builds its ranges, and every number on this page can be traced back to that model. If another tool gives you one hour with no range and no cutoff named, treat that hour as marketing, not measurement.
Detection windows at a glance (4 drinks, one session)
| Cutoff | Typical users | Modeled window | When it closes |
|---|---|---|---|
| 100 ng/mL | Probation, courts, zero-tolerance programs | 30–68 hours | Last — strictest bar takes longest to clear |
| 200 ng/mL | Treatment and clinical monitoring programs | 26–59 hours | Middle — between strict and standard |
| 500 ng/mL | Workplace, general screening | 20–46 hours | First — standard bar clears earliest |
Frequently asked questions
How long does it take EtG to fully leave your system?
There is no single answer, because it depends on how much you drank and which cutoff the test uses. For a few drinks, the modeled window closes within roughly one to three days depending on cutoff; for heavier or repeated drinking it can run longer. The calculator above gives you the range for your own numbers at all three cutoffs, which is more honest than any single clearance hour.
Does EtG drop steadily, hour by hour?
Roughly, yes — EtG is eliminated with a half-life of about 2 to 3 hours, so the amount roughly halves every few hours. But a urine test does not measure a smooth blood curve: it measures what is in one urine sample at one moment, and dilution changes the concentration. That is why this tool reports windows and timeline statuses, not a minute-by-minute level.
Why do different elimination calculators give different times?
Because they make different hidden choices: which cutoff, which half-life, and whether they use a fixed peak level per drink. A calculator that assumes one fixed ng/mL per drink will always output one tidy hour — and that hour is an artifact of its constants, not a measurement of you. This calculator uses the published 2–3 hour half-life range and shows all three cutoffs, so you can see exactly where the disagreement comes from.
Can I speed up EtG elimination?
No reliable shortcut exists. Drinking water dilutes urine, which lowers the measured concentration in a sample, but it does not remove EtG faster, and labs check creatinine and specific gravity to flag diluted samples. Time is the only thing that clears EtG; anything sold as a cleanse or detox has no published evidence behind it for EtG.
Does the timeline change if I drank on several days in a row?
Yes. Repeated drinking stacks EtG: each new session adds to what is still clearing from the last. Choose “Repeated” in the calculator and the modeled windows extend — roughly 16 extra hours at the top end in this model — because the body never gets a clean run at clearing the backlog.
Is this elimination timeline a pass or fail prediction?
No. Urine concentration, kidney function, test method (immunoassay screening vs. LC-MS/MS confirmation), incidental exposure, and individual metabolism can all move a real result away from the model. Use the timeline to understand where the uncertainty sits, never to make medical, legal, employment, or supervision decisions.
Evidence and limitations
This page summarizes primary research and public-health guidance. Group-level findings cannot predict one person's result.
Sources: