What sensitivity and specificity mean for an EtG urine test
Sensitivity describes how often a test identifies the drinking events defined by a study's reference method. Specificity describes how often comparison observations remain negative under that same design. These are properties of a test used at a particular cutoff in a particular population and time window. They are not fixed labels permanently attached to the letters EtG.
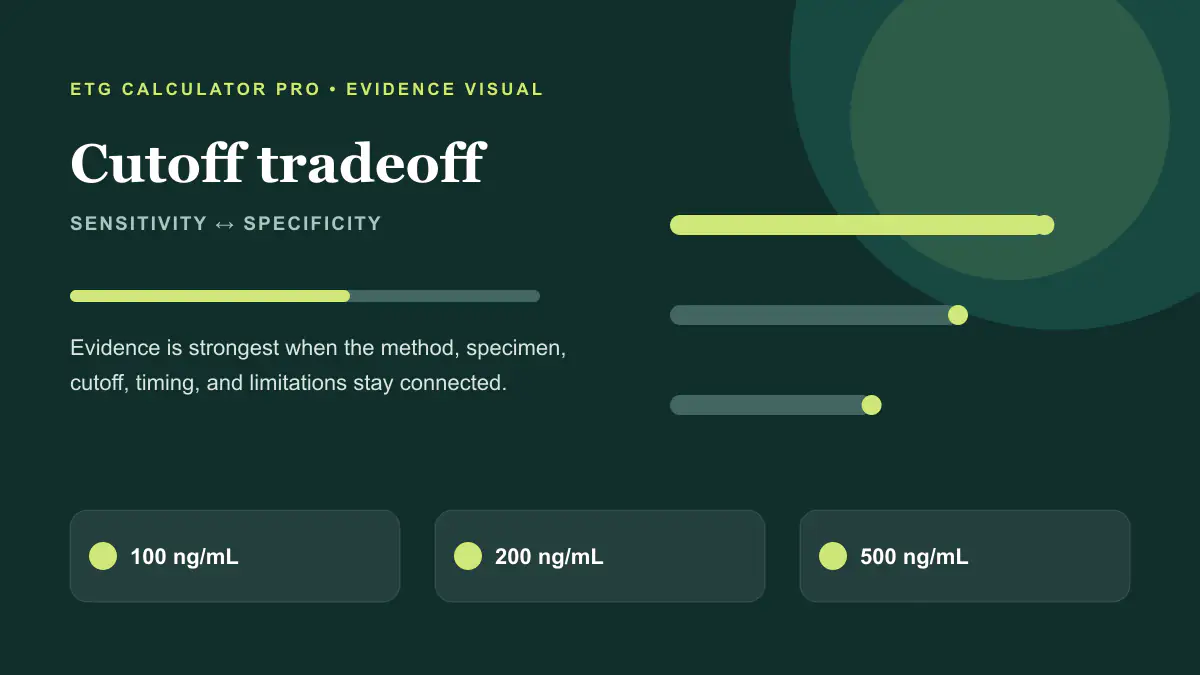
For example, a 100 ng/mL cutoff may detect more light or older exposure than 500 ng/mL, increasing sensitivity. The lower threshold can also classify more low-level exposure, including circumstances where incidental ethanol is relevant, which may reduce specificity. Raising the cutoff usually reverses that tradeoff. The appropriate threshold depends on the testing purpose and the consequences of false negative and false positive classifications.
Related: EtG cutoff guide · 100 vs 500 ng/mL comparison
Why elapsed time changes sensitivity
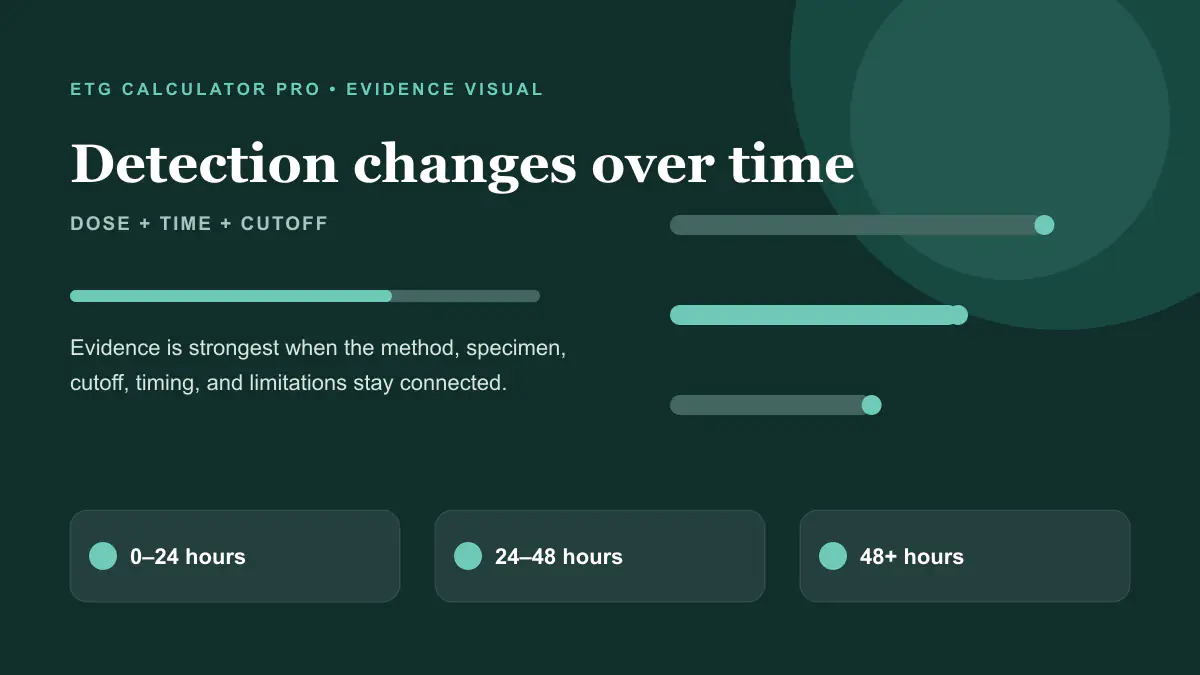
EtG concentration generally rises after ethanol exposure and later declines as the metabolite is eliminated. A specimen collected during the first day is therefore more likely to remain above a cutoff than one collected several days later, all else equal. Light exposure may fall below 500 ng/mL sooner than heavy or repeated exposure. Lower cutoffs can extend detection, but the late window remains uncertain rather than guaranteed.
Research often reports performance at scheduled intervals such as 24, 48, 72, 96, or 120 hours. Those intervals are group summaries. Individual collection timing, the end of drinking, urine voids, creatinine, renal function, and analytical method introduce variation around them. A phrase such as '80-hour test' ignores the changing sensitivity across the window and can mislead users into treating maximum capability as consistent performance.
Related: 24, 48, 72, and 80 hours explained · The 80-hour claim
Why alcohol dose and pattern matter
A larger ethanol exposure generally creates more metabolite available for excretion, so heavy drinking is usually detected more consistently and for longer than a light event. Repeated drinking across multiple days can also widen the window. However, dose does not map to one concentration because absorption, body water, metabolism, collection time, and urine concentration vary substantially.
Studies that separate light and heavy self-reported drinking are valuable because they show that a test's sensitivity depends on what it is trying to detect. A cutoff that performs well for heavy drinking yesterday may perform poorly for light drinking several days ago. When comparing competitors or laboratory claims, check whether 'accuracy' refers to any drinking, heavy drinking, a specific interval, or a combined outcome.
Related: Convert exposure to U.S. standard drinks · Explore dose and cutoff ranges
What the 100–500 ng/mL research demonstrates
Lowe and colleagues evaluated cutoffs from 100 through 500 ng/mL across multiple days in alcohol-dependent outpatients. Lower thresholds generally offered better sensitivity over longer intervals, while higher thresholds improved specificity. McDonell and colleagues similarly found that 100 ng/mL was more useful for detecting drinking across longer windows, whereas 500 ng/mL was more oriented toward recent or heavier drinking.
These findings do not select one universally correct cutoff. A treatment program prioritizing detection of recent drinking may choose differently from a setting concerned about low-level environmental exposure. Analytical method, confirmation, and policy also matter. The responsible conclusion is a tradeoff table, not a claim that one threshold is accurate and the others are wrong.
Reference standards can change the reported accuracy
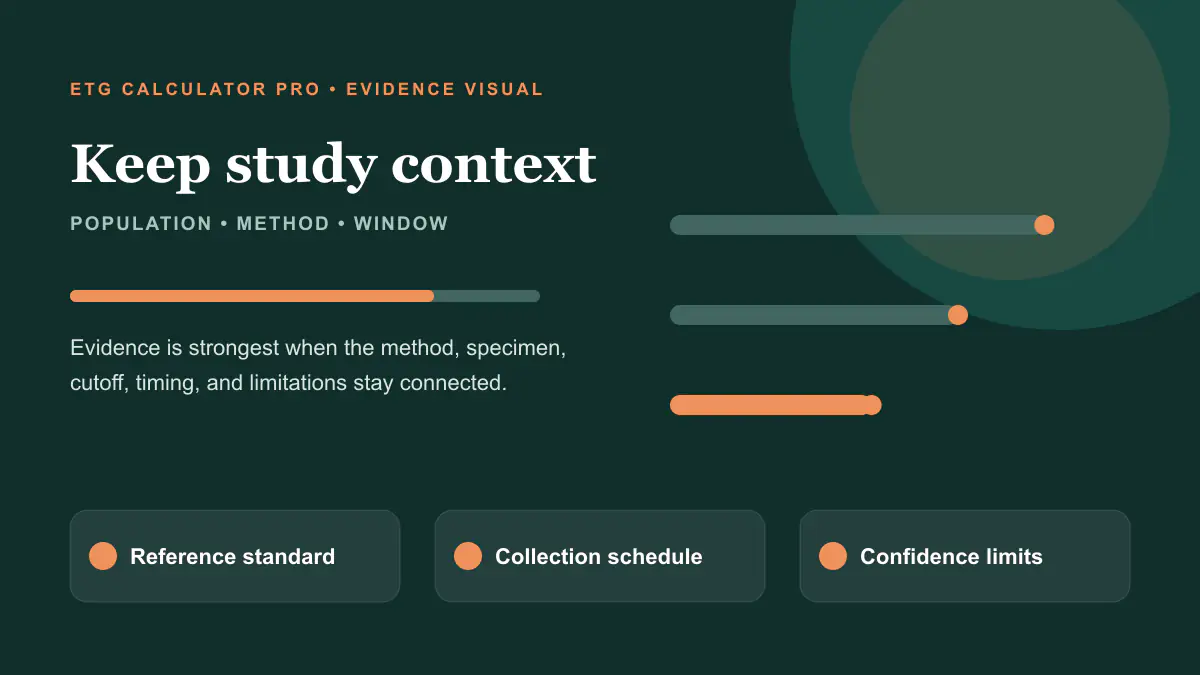
Diagnostic-accuracy research needs a reference for whether exposure occurred. Controlled dosing provides known alcohol administration and timing, but the controlled environment may not represent real-world repeated drinking. Self-report studies reflect real populations but can include recall error or under-reporting. Population studies may use questionnaires or consumption categories that do not align perfectly with the urine collection window.
Sensitivity calculated against 'any self-reported drinking in two days' answers a different question from sensitivity after a controlled high dose at 24 hours. Specificity among self-reported abstainers can also be affected by undisclosed exposure or incidental products. Good interpretation describes the reference standard instead of quoting a percentage without its denominator and definition.
Related: Compare EtG study designs
Prevalence, predictive value, and the individual result
Sensitivity and specificity do not directly tell a person the probability that a positive result proves a particular drinking event. Positive and negative predictive values also depend on how common the target exposure is in the tested population. A test used in a high-prevalence treatment group can have a different predictive context from the same cutoff used in a low-prevalence workplace population.
This distinction is one reason EtG Calculator Pro does not display a personalized percentage. The tool lacks a validated prior probability, measured urine concentration, creatinine, assay, reference policy, and many health variables. It displays broad modeled bands to explain relative factors, not a diagnostic probability. Only an actual specimen and qualified interpretation can establish the reported result.
Related: Why the calculator uses ranges
Incidental exposure and specificity
EtG is formed after ethanol exposure, and ethanol can come from beverages or alcohol-containing products. Hand sanitizer, mouthwash, liquid medicines, foods, and occupational sources are most relevant to low-level interpretation and sensitive cutoffs. Their presence does not automatically invalidate a positive, and they should not be used as a universal explanation for clearly elevated values.
Specificity improves when collection instructions, product restrictions, confirmation methods, EtS, creatinine, and clinical context are handled consistently. A higher cutoff is one strategy, but it sacrifices sensitivity. The best policy defines the target exposure and confirmation pathway before testing rather than changing the interpretation after an unexpected result appears.
How to read an accuracy claim
When a laboratory, home-test seller, or calculator states that an EtG test is highly accurate, ask six questions: accurate for which analyte, specimen, cutoff, method, exposure definition, and collection interval? Then inspect the population size and whether the result was confirmed. A single accuracy percentage that merges several time points or doses can hide clinically important differences.
Also distinguish analytical accuracy from clinical classification. A mass-spectrometry method can quantify EtG accurately while the biological meaning remains uncertain. Conversely, a screening assay can classify most specimens correctly in its intended population without being the preferred method for a disputed individual result. Both layers deserve precise language.
- Population and sample size
- Reference standard
- Exposure amount and pattern
- Collection interval
- Cutoff and analytical method
- Confidence intervals and limitations
What sensitivity and specificity cannot promise
No sensitivity estimate guarantees that a drinking event will be detected, and no specificity estimate guarantees that every positive represents beverage use. These metrics summarize observed study performance under defined conditions. Individual biology and urine collection introduce variation that remains even when the study is well designed.
Use diagnostic-accuracy evidence to understand tradeoffs and build fair testing policies, not to reverse-engineer a pass/fail countdown. If a result affects health, work, supervision, or legal status, obtain the complete laboratory report and qualified interpretation. The calculator and guides can help you ask better questions, but they cannot replace that process.
Related: EtG accuracy and result FAQs
Frequently asked questions
What is the most sensitive EtG cutoff?+
Among 100, 200, and 500 ng/mL, 100 ng/mL is generally the most sensitive because it reports lower concentrations. That sensitivity also creates more low-level incidental-exposure concerns.
Is 500 ng/mL more accurate than 100 ng/mL?+
It is not universally more accurate. Five hundred ng/mL is generally more specific but less sensitive, especially for light or older drinking. The better cutoff depends on the testing objective.
Does 90% sensitivity mean I have a 90% chance of testing positive?+
Not necessarily. Study sensitivity applies to a defined population, exposure, method, cutoff, and collection interval. Your circumstances may not match those conditions.
Does a negative EtG test rule out drinking?+
No. Exposure can be missed when it is light, old, below the cutoff, or measured in dilute urine. A negative means the specimen was below the test's reporting threshold.
Why do EtG studies report different performance?+
Studies differ in population, reference standard, dose, drinking pattern, collection schedule, cutoff, analytical method, and definition of a positive exposure.
Evidence and limitations
This guide summarizes primary research and public-health guidance. Group-level findings cannot predict one person's result.